August Through the Eyes of Our Meteorologist: Sun, Wind, and Anemometers
Plenty of sunshine, a brisk wind at the start, and anemometers
Our very own “in-house meteorologist,” Ryan Sondij, takes a closer look at the numbers. How much did the sun shine, how strong were the winds, and what did that mean for renewable energy production in the Netherlands?
August—the meteorological summer has flown by. August was a month of ups and downs. The month started out warm and dry, after which temperatures dropped slightly and some much-needed rain fell. As a result, August wasn’t quite as record-breaking as the previous months. Nevertheless, the summer of 2026 will go down in history as the warmest since records began in 1901. In addition, 2026 ranks among the driest 5% of months ever recorded. The first two weeks of August also saw plenty of sunshine, which was the main reason August 2026 was sunnier than usual: 252 hours of sunshine compared to the usual 205 hours.
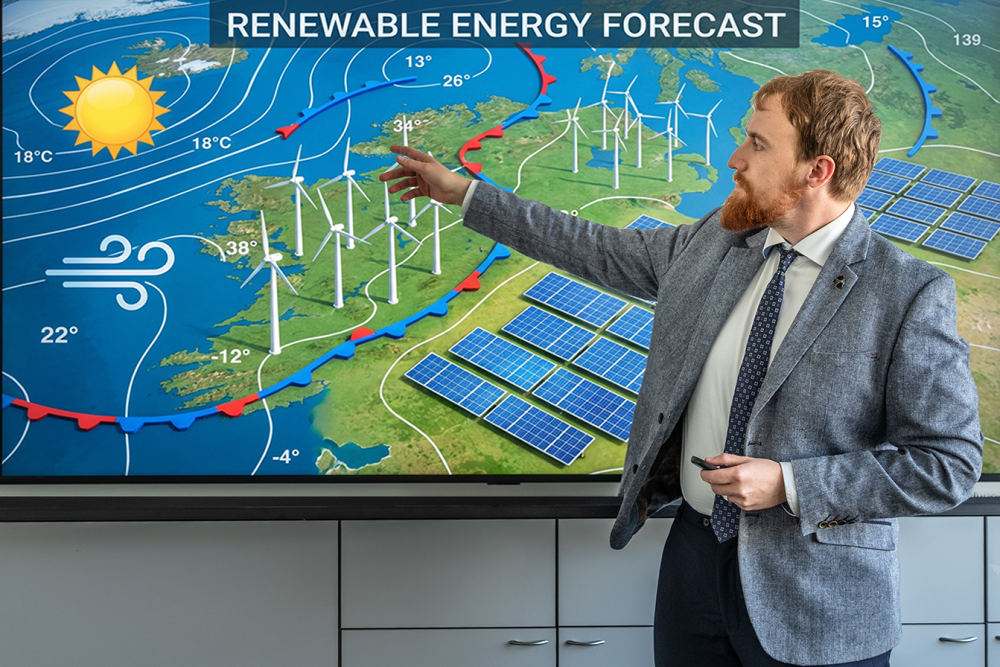
In terms of wind, conditions in August ranged from calm to moderate. There were no official summer storms that brought stronger winds. However, it is quite normal for winds to be relatively light in August compared to the winter months. Winds were particularly light in the first half of the month, which was dominated by high-pressure systems. They picked up somewhat in the second half. Starting on August 15, we regularly experienced low-pressure systems, resulting in precipitation, lower temperatures, and slightly stronger winds. The last weekend of August, in particular, was marked by higher wind speeds, which gave energy farms’ production figures a nice boost.
Your weatherman has also tried to compare August’s wind speeds with those of previous years. To do this, it’s important that we briefly discuss how wind is measured, particularly at a wind turbine.
Wind speeds are measured on wind turbines using devices called anemometers. There are many types of anemometers, but the two main ones are cup anemometers and sonic anemometers. The first type consists of three cups mounted on horizontal arms around a vertical axis. These cups, so to speak, catch the wind, causing them to rotate around the axis. The faster they spin, the stronger the wind. The sonic anemometer uses three pairs of ultrasonic transmitters and receivers. These transmitters send sound pulses to the receivers. Depending on the strength and direction of the wind, these pulses may reach the receivers faster or slower. Based on this acceleration or deceleration, the wind speed and direction can be determined. These anemometers are often mounted on the nacelle, at the top of the turbine. This allows us to know how strong the wind is at hub height. However, mounting anemometers on the nacelle has one major drawback: relative to the wind, they are always positioned behind the rotor blade. The rotor blade already captures a significant amount of wind, which disturbs the airflow and prevents the anemometers from measuring the unobstructed wind. It’s a bit like trying to measure solar radiation while sitting in the shade. Therefore, it’s important to take these measurements with a grain of salt.
Nevertheless, it’s interesting to make a comparison, especially since these disruptions are occurring both this year and in previous years. It’s therefore interesting to see how the wind speeds recorded this August compare to those recorded in previous Augusts. What immediately stands out is that, compared to the past 5 years, August 2026 was the windiest August. In particular, the inland and southeastern regions experienced significantly more wind than in the past 5 years. In the west and north, there was also more wind than usual, but to a lesser extent. This also resulted in relatively good production for the month of August. As a result, many wind farms met their monthly production targets.
Team
Meet the GreenTrusters behind this news


